
ABLE Product Launch to Date
By Paul Curley, CFA | paul.curley@strategic-i.com | June 18, 20183 Trends in ABLE Accounts for Product Managers
ABLE accounts are tax-advantaged savings accounts for certain individuals with disabilities and their families, while safe guarding eligibility for means-tested federal benefits. ABLE stands for “achieving better life experience,” and was originally created due to the passage of the Stephen Beck Jr., Achieving a Better Life Experience Act of 2014 (“ABLE Act”). In structure, they are similar to 529 college savings plans in that they are administered by state agencies and several states provide state income tax benefits for making contributions. Additionally, ABLE plans allow for after-tax contributions, provide tax free growth and tax free distributions for qualified distributions. Assets accumulated in ABLE accounts may be used for a broad definition of qualified disability expenses so long as the expenses relate to the individual’s disability or blindness, and are for his or her benefit. Items that may pertain to this definition include: Education, housing, transportation, employment training and support, assistive technology and services, health and wellness, financial management, legal fees and funeral expenses. While the list is not exhaustive, the purpose of the expenditure should be consistent with the intent of ABLE accounts and more information can be found in plan disclosure statements. Therefore, ABLE accounts provide certain families with a tax advantaged ability to save and save efficiently.
ABLE programs are live, active and growing. On June 1, 2016, the first ABLE program was launched for nationwide use by the Ohio Treasurer’s Office with a label of “STABLE Account.” As of June 12, 2018, 37 states administer 38 ABLE programs and those numbers are expected to continue to grow. To help gauge this growth, this article provides an overview of the ABLE product launch to date by providing three market data trends based on proprietary data by Strategic Insight. The three market data trends pivot around the classic product analysis paradigm of analyzing market data on the volume of inputs by way of contributions, the activity of the product by way of market sizing and the output of the product by way of distributions. Therefore the three trends review the product lifecycle of money going in, growing while in the product and exiting.
Overview of the Three Trends:
1) Input – This trends analyzes how investors are making gross contributions into ABLE Accounts. Strategic Insight defines gross contributions as defined as contributions or gross sales during quarter. Gross Sales include rollover in transactions. From 2Q 2016 to 1Q 2018, total gross contributions have totaled $105.5 million with $28.0 million coming in 1Q 2018. Based on this data and Exhibit 1, momentum of assets going into ABLE accounts continues to grow. This momentum is expected to continue as 67% of accounts made contributions in 1Q 2018 with an average contribution size of $2,486. Therefore families are investing in ABLE accounts.
Exhibit 1

2) Activity – 20,653 accounts invested $98.6 million in assets as of the end of 1Q 2018. As noted in Exhibit 2, both the number of accounts and total assets in ABLE accounts continue to grow on a quarter-over-quarter basis to new all-time highs. Building upon the assets and number of accounts, the average account size continues to rise quarter over quarter and are currently reported as $4,774 as of 1Q 2018. In terms of what the assets invest in, roughly 25% of assets invest in checking and/or bank investment options. Inversely, 75% of assets are invested in market appreciation related assets. Therefore families are using ABLE accounts to both invest and protect assets.
Exhibit 2

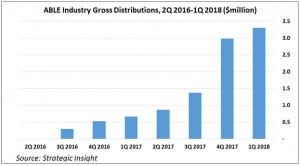
3) Output – This trends analyzes how investors are taking gross distributions out of ABLE Accounts. Strategic Insight defines gross distributions as defined as withdrawals or gross distributions during quarter. Gross Distributions include rollover out transactions. From 2Q 2016 to 1Q 2018, total gross distributions have totaled $10.0 million with $3.3 million taking place in 1Q 2018. Based on this data and Exhibit 3, usage of ABLE assets departing from ABLE accounts continues to grow. This momentum is expected to continue as 5.7% of accounts made distributions in 1Q 2018 with an average distribution size of $1,715. These distributions from ABLE accounts is positive news is it shows that families are successfully using ABLE accounts to improve their quality of life.
Exhibit 3
Based on analysis of putting the three trends together, ABLE accounts will continue to grow in assets, accounts and number of plans as families put money in, grow and use the assets. While new mutual funds and exchange traded products are fairly common, it is uncommon for a whole new product structure to get introduced such as ABLE accounts. Therefore product providers have an opportunity to learn about and from these brand new ABLE programs from a product, marketing and distribution perspective, and Strategic Insight will continue to create and report data and analysis on them from the industry perspective.
ABLE programs are live, active and growing. On June 1, 2016, the first ABLE program was launched for nationwide use by the Ohio Treasurer’s Office with a label of “STABLE Account.” As of June 12, 2018, 37 states administer 38 ABLE programs and those numbers are expected to continue to grow. To help gauge this growth, this article provides an overview of the ABLE product launch to date by providing three market data trends based on proprietary data by Strategic Insight. The three market data trends pivot around the classic product analysis paradigm of analyzing market data on the volume of inputs by way of contributions, the activity of the product by way of market sizing and the output of the product by way of distributions. Therefore the three trends review the product lifecycle of money going in, growing while in the product and exiting.
Overview of the Three Trends:
1) Input – This trends analyzes how investors are making gross contributions into ABLE Accounts. Strategic Insight defines gross contributions as defined as contributions or gross sales during quarter. Gross Sales include rollover in transactions. From 2Q 2016 to 1Q 2018, total gross contributions have totaled $105.5 million with $28.0 million coming in 1Q 2018. Based on this data and Exhibit 1, momentum of assets going into ABLE accounts continues to grow. This momentum is expected to continue as 67% of accounts made contributions in 1Q 2018 with an average contribution size of $2,486. Therefore families are investing in ABLE accounts.
Exhibit 1
2) Activity – 20,653 accounts invested $98.6 million in assets as of the end of 1Q 2018. As noted in Exhibit 2, both the number of accounts and total assets in ABLE accounts continue to grow on a quarter-over-quarter basis to new all-time highs. Building upon the assets and number of accounts, the average account size continues to rise quarter over quarter and are currently reported as $4,774 as of 1Q 2018. In terms of what the assets invest in, roughly 25% of assets invest in checking and/or bank investment options. Inversely, 75% of assets are invested in market appreciation related assets. Therefore families are using ABLE accounts to both invest and protect assets.
Exhibit 2
3) Output – This trends analyzes how investors are taking gross distributions out of ABLE Accounts. Strategic Insight defines gross distributions as defined as withdrawals or gross distributions during quarter. Gross Distributions include rollover out transactions. From 2Q 2016 to 1Q 2018, total gross distributions have totaled $10.0 million with $3.3 million taking place in 1Q 2018. Based on this data and Exhibit 3, usage of ABLE assets departing from ABLE accounts continues to grow. This momentum is expected to continue as 5.7% of accounts made distributions in 1Q 2018 with an average distribution size of $1,715. These distributions from ABLE accounts is positive news is it shows that families are successfully using ABLE accounts to improve their quality of life.
Exhibit 3
Based on analysis of putting the three trends together, ABLE accounts will continue to grow in assets, accounts and number of plans as families put money in, grow and use the assets. While new mutual funds and exchange traded products are fairly common, it is uncommon for a whole new product structure to get introduced such as ABLE accounts. Therefore product providers have an opportunity to learn about and from these brand new ABLE programs from a product, marketing and distribution perspective, and Strategic Insight will continue to create and report data and analysis on them from the industry perspective.